Analytics
TestingBot provides detailed analytics about your test sessions. We provide you with graphs and metrics, allowing you to:
- Reduce time spent analyzing test results
- Locate bottlenecks in your test performance
- See for which browsers and platforms your tests are flaky and more prone to failure
- Determine if a build is release quality
Filters
Our analytics filters allow you to drill down on your metrics and visualize the information you need.
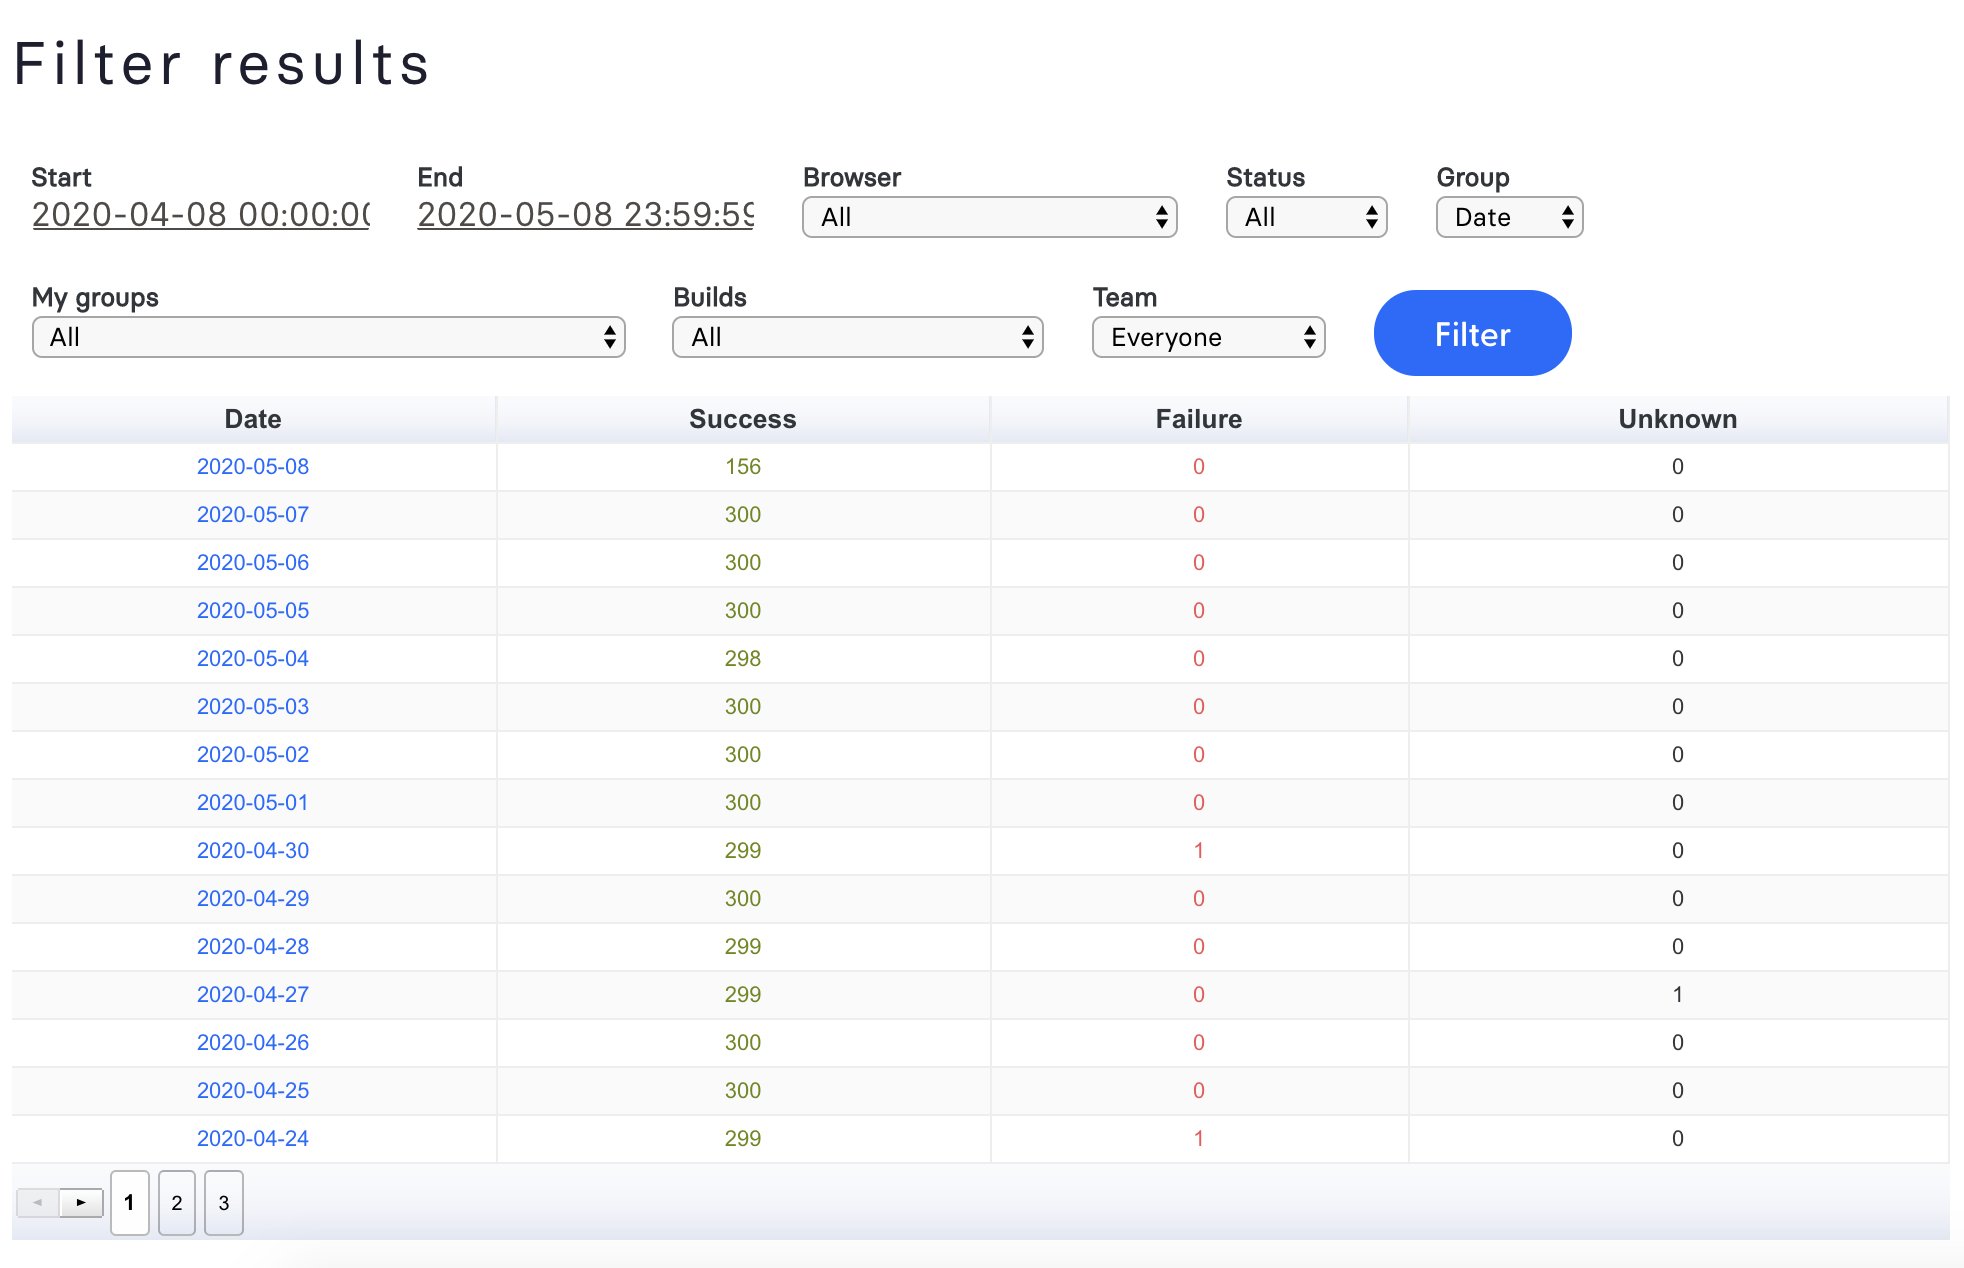
You can filter on several things, including:
- Start/End time of the test
- Browser/Device
- Status (Passed, Failed, Unknown)
- Group by date/status
- Filter by Build
- Filter by groups: only show tests that have a group (tag) included in their desired capability.
- Filter by team member
Graphs
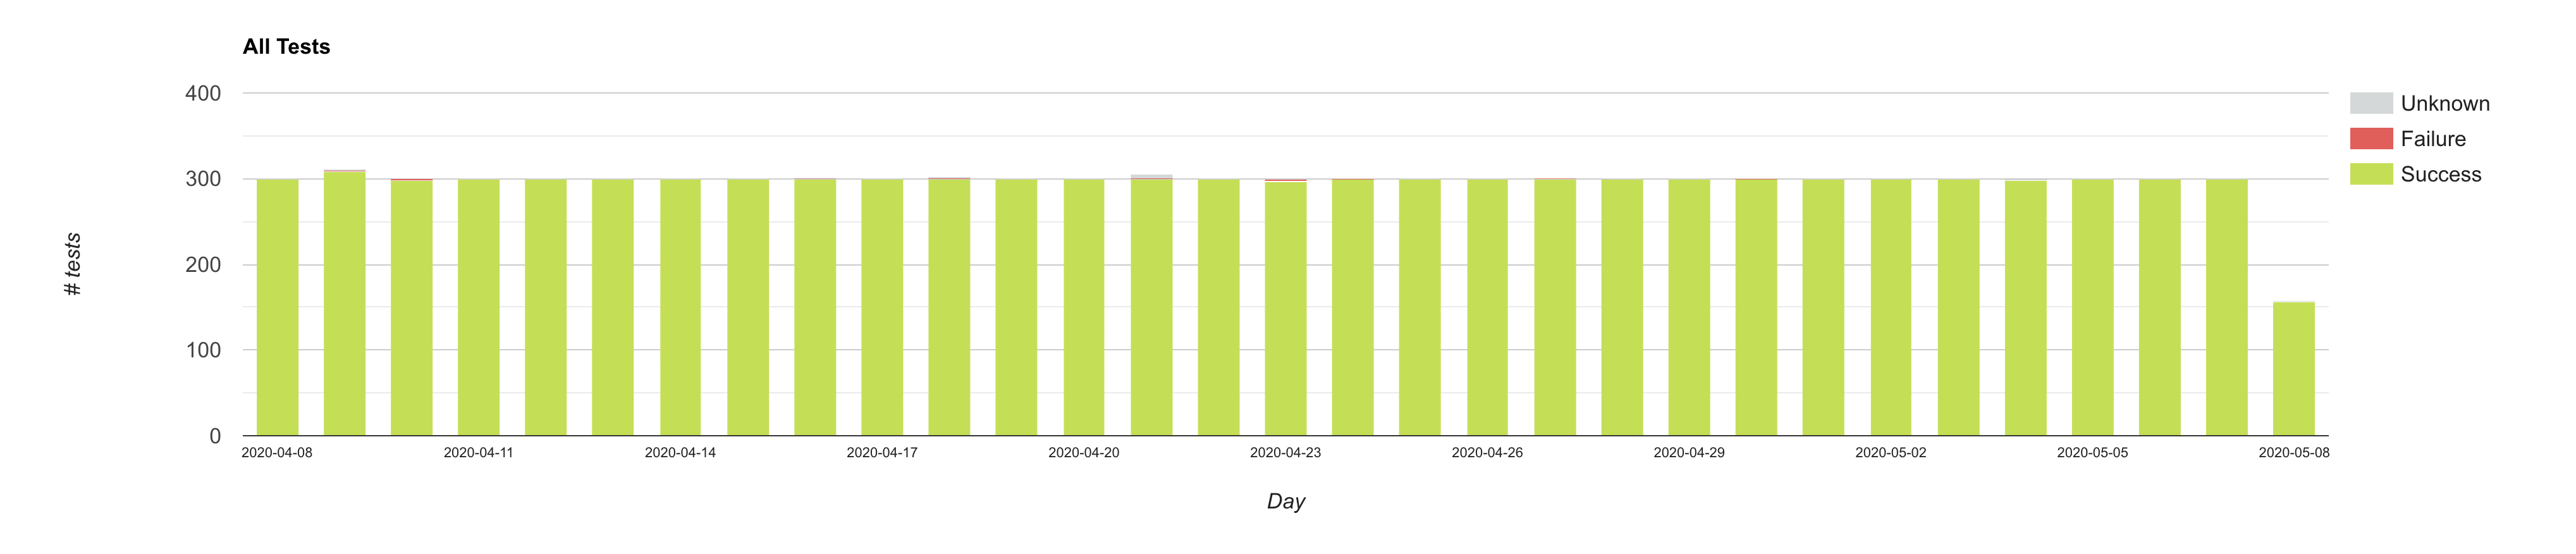
One of the first graphs you'll see is the graph above. This Column Chart shows an overview of the pass/fail rate for all your tests, grouped by day, for the last 31 days.
Each column represents a day, and may include:
- Passed/Success: all tests marked as passed
- Failure: all tests marked as failed
- Unknown: we don't know the status about this test. Please use our API to mark this test as passed/failed.
Using the filter, you can change the date range and filter by various things (see above).
If you click part of the graph, you'll navigate to an overview of all tests for that specific part.